Interactive and animated maps
Animated maps
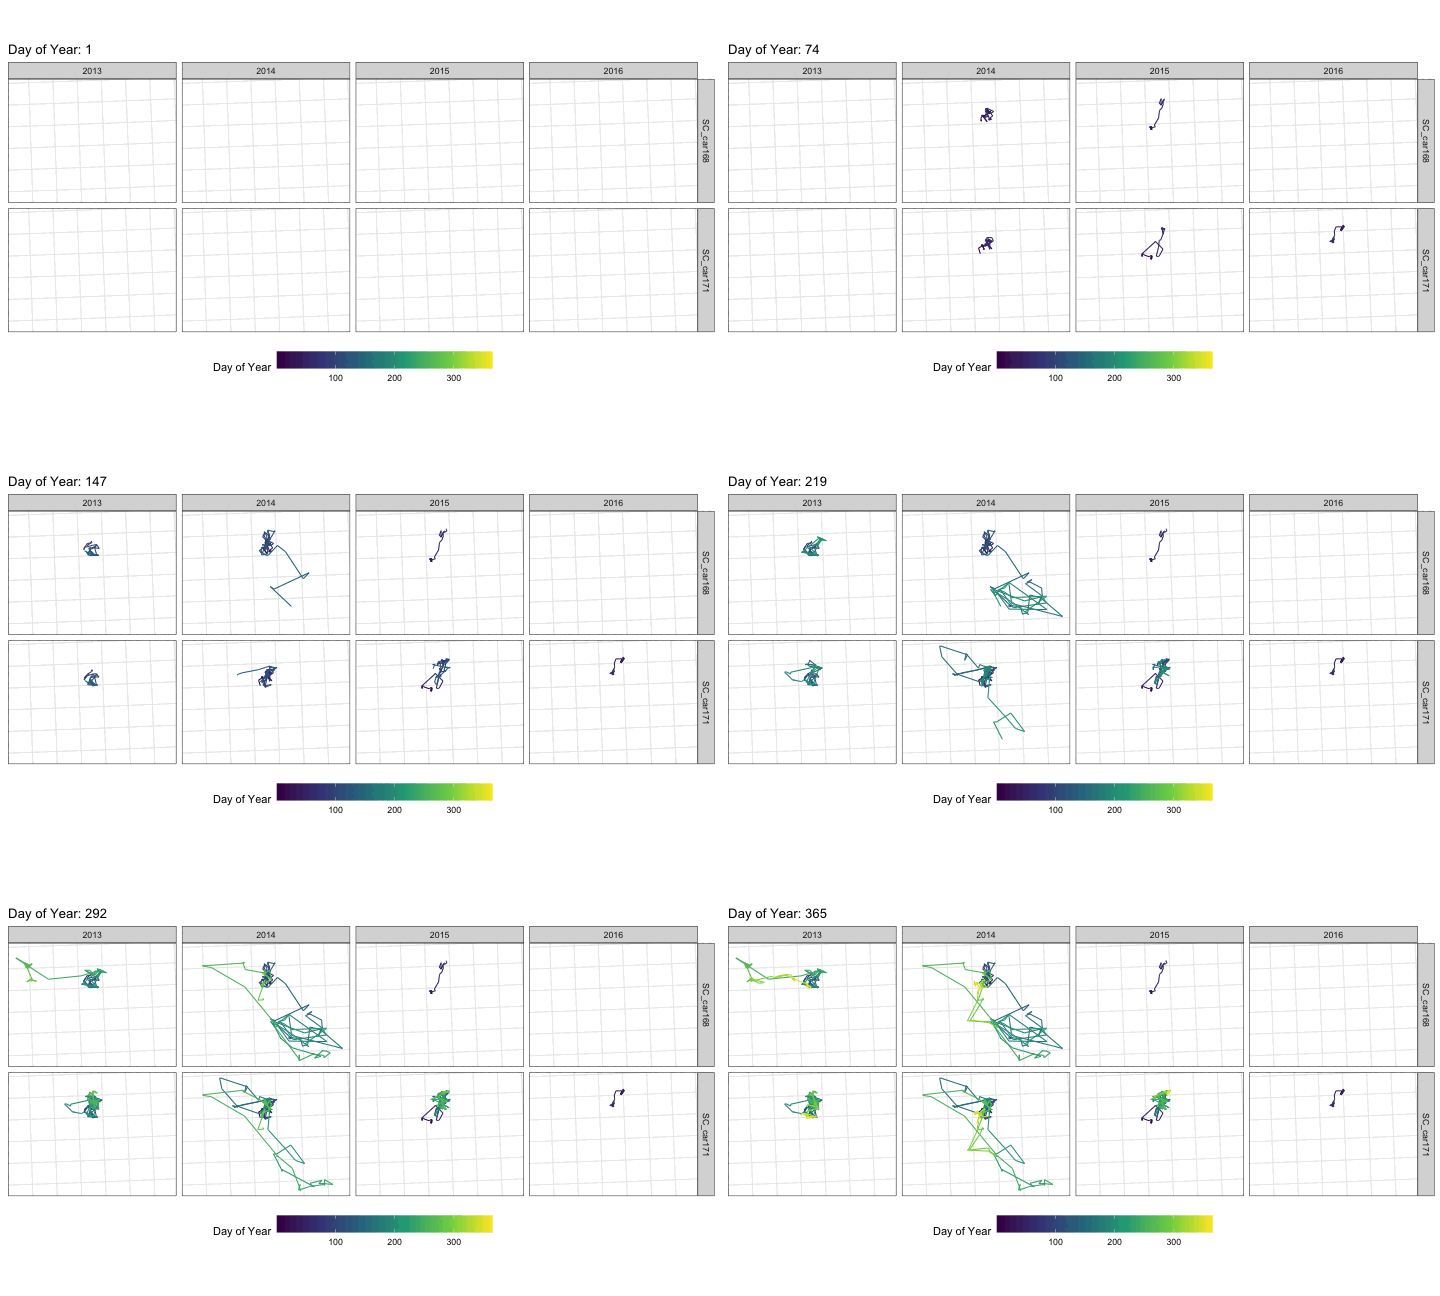
We can visualize movement by animating their tracks, using the gganimate package.
Let’s start with the map we made earlier of the paths of two animals, faceted by year:
scott <- read_sf("clean_data/scott_herd_subset.gpkg")

scott <- cbind(st_coordinates(scott), scott)

top_animals <- c("SC_car171", "SC_car168")

mvmt <- scott |> filter(animal.id %in% top_animals) |>
  mutate(doy = lubridate::yday(date2))


p <- ggplot(mvmt) +
  geom_path(aes(x = X, y = Y, colour = doy)) +
  facet_grid(animal.id ~ year) +
  scale_color_viridis_c() +
  coord_sf() +
  labs(colour = "Day of Year") +
  theme_bw() +
  theme(
    axis.text = element_blank(),
    axis.ticks = element_blank(),
    axis.title = element_blank(),
    legend.position = "bottom",
    legend.key.width = unit(3, "lines")
  )
We then add a transition to the plot that reveals each step along the path, and create an animated gif:
p_animate <- p +
  transition_reveal(along = doy) +
  labs(title = "Day of Year: {round(frame_along)}")

animate(
  p_animate,
  width = 10,
  height = 6,
  units = "in",
  res = 72,
  fps = 10,
  nframes = 300
)
Interactive maps with {Leaflet}
Let’s use the file that has the caribou locations with the attributes from the base layers
library(dplyr)
library(leaflet)

all_pts <- read_sf("clean_data/allpts_att.gpkg") |>
  st_transform(4326)

caribou <- filter(all_pts, !is.na(animal.id))
background <- filter(all_pts, is.na(animal.id))

animal_pal <- colorFactor(
  palette = "viridis",
  domain = unique(caribou$animal.id)
)

leaflet(caribou) |>
  addProviderTiles(providers$Esri.NatGeoWorldMap) |>
  addCircleMarkers(
    data = background,
    color = "grey",
    radius = 1
    ) |>
  addCircleMarkers(
    color = ~ animal_pal(caribou$animal.id),
    weight = 1,
    radius = ~ elevation / 300,
    popup = ~ paste0(
      "Animal: ", animal.id, "<br>",
      "Elevation: ", round(elevation)
    )
  ) |>
  addLegend(
    "bottomleft",
    pal = animal_pal,
    values = ~ caribou$animal.id,
    title = "Animal ID"
  )